Our trading signal analysis is based on a comprehensive summary of market data. We use a range of metrics with weighting given to simple and exponential moving averages and key technical indicators.
We created this Weekly Tips section so that we can share possible trade entry and exit points based on technical analysis. In addition, we have other methods to validate our trades, which we can’t publicly share, that help to increase their success. All our trades include entry and at least one target price. Stop losses are applied at reader discretion. Our strategies typically trade with a wide stop loss and risk is further mitigated by trading in small size.
Instrument | Hourly | Daily | |
EUR/USD | 1.1251 | Strong Sell | Strong Sell |
GBP/USD | 1.3200 | Strong Sell | Strong Sell |
USD/JPY | 113.40 | Strong Buy | Buy |
S&P 500 | 4,558 | Strong Sell | Neutral |
NASDAQ 100 | 15,597 | Strong Sell | Strong Sell |
FTSE100 | 7,133 | Strong Buy | Strong Buy |
Gold | 1.800 | Sell | Strong Buy |
Crude Oil WTI | 68.05 | Strong Sell | Strong Sell |
Bitcoin | 46,221 | Strong Sell | Strong Sell |
Ethereum | 3,821 | Strong Sell | Strong Sell |
UTC 08:30
FOCUS ON: INDICES TRADE SIGNALS
There is an end to the year feeling in the markets with the coming week shortened due to national holidays and the upcoming calendar being light in terms of economic data releases. Negative sentiment appears to be dominating trading desks thanks to hawkish guidance from the US Federal Reserve last Wednesday.
Nasdaq 100
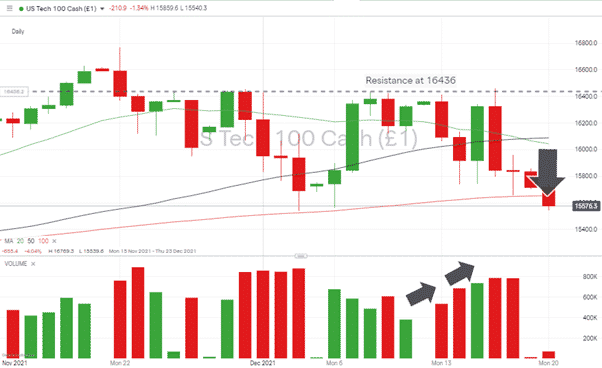
Nasdaq 100 Daily Chart – Trading under Daily SMAs / Price High Resistance / Uptick in Volumes
Source: IG
Last week’s report identified the key price-high resistance at 16,436, which did resist moves to breach it. There was always a chance for a pullback in tech stocks thanks to the December price rally not being backed by an increase in trade volumes. The sell-off was, however, matched by an increase in trading volumes, which is a bearish indicator.
Weakness in the Nasdaq 100 continued into the Asian session on Monday morning. Price action can only be described as bearish, and the path of least resistance appears to be downwards. Any rebound would have to work its way through all the major daily SMAs, which are above current price levels.
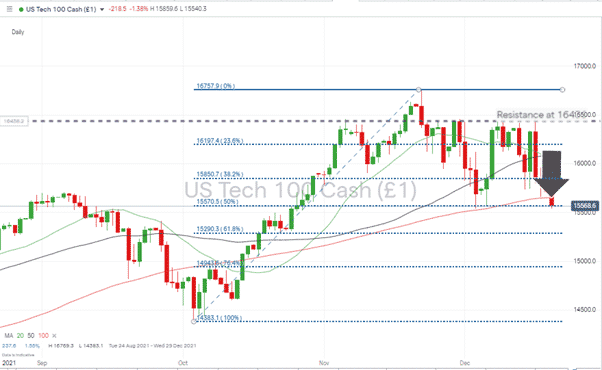
Nasdaq 100 Daily Chart – Fib Retracement coming into play
Source: IG
Short positions
- Entry Level 1: Region of 15,653 the current 100 Daily SMA. Selling into any strength.
- Price Target 1: 15,290 61.8% Fib retracement from 4th October low
- Price Target 2: 14,383 swing low of 4th October
- Stop Loss: Aggressive stops set above 100 Daily SMA. Less aggressive above price-high resistance at 16,436.
S&P 500
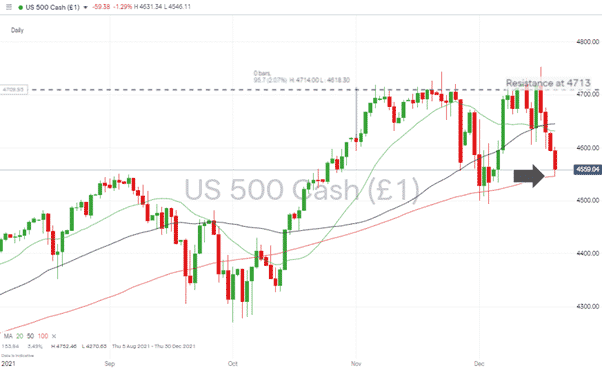
S&P 500 Daily price chart – Key SMA Price Support Coming into Play
Source: IG
The S&P 500 lost more than 3% of value over the previous trading week and a lot of that price slide occurred in the early hours of 20th December. With the week’s trading volumes anticipated to be low due to the holidays, there could well be a dip-buying opportunity at some point during the week. Selling pressure could well tail off, but the adage advising against ‘catching a falling knife’ also comes into play.
All eyes are on the 100 Daily SMA currently at 4,546, which has been a key indicator throughout the year.
Short positions
- Entry Level 1: 4,546 – Current level of 100 Daily SMA. A breakthrough of this would suggest further downside movement
- Entry Level 2: Region of 4,710 – 20 Daily SMA on hourly chart
- Price Target 1: 4,360 – Price low of 1st October
- Stop Loss: Region of 4,645 – 50 Daily SMA
Long positions
- Entry Level 1: Region of 4,546 – Current level of 100 Daily SMA. If this support holds, few would bet against a relief rally on low trading volumes
- Price Target 1: 4,360 Price low of 1st October
- Stop Loss: 4,494 – Swing low and monthly low-price print of 3rd December
FTSE 100
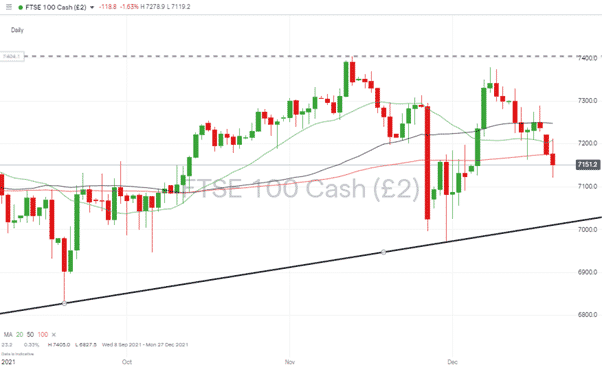
Currently printing prices below the main daily moving averages, the FTSE is adjusting to news that the Bank of England has started bringing interest rate hikes into place.
FTSE 100 – Daily price chart –Below 20, 50 & 100 Daily SMA’s.
Source: IG
Short positions
- Entry Level 1: Region of 7,174 – Selling into any short-term strength, which takes price back to 100 Daily SMA
- Price Target 1: 7,000 – ‘Big number’ and trend line support level
- Stop Loss: Region of 7,208 and 7,207 – Current levels of 20 and 50 SMAs
Long positions
- Entry Level 1: 7,000 Trend line and ‘big number’ support
- Price Target 1: Region of 7,174 – The current level of 100 Daily SMA
- Stop Loss: < 6,971 – below supporting trend line and swing low of 30th November
Forex
The US Dollar index has been consolidating over the past two weeks, but there was little in the Fed’s statement to suggest the long-term upward trend is being challenged.
GBPUSD
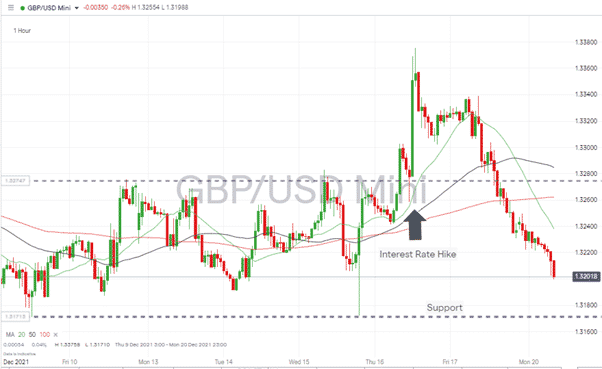
Thursday’s interest rate hike by the Bank of England may have caught some by surprise, but the +50 basis points price spike was a short-term move. Sterling’s slide into the end of the week was followed by more weakness on Monday morning and the key short-term price support of 1.31614 is coming into play.
GBPUSD – 1H chart – Interest Rate Hike offers only Short-term support
Source: IG
Short positions
- Entry Level 1: 1.3200 – Psychologically important price level and region of last Wednesday’s swing low
- Price Target 1: 1.3172 – Low of previous week
- Price Target 2: 1.31614 – Low of 8th Dec and bottom of sideways channel
- Stop Losses: > 1.32582 – Current level of 20 Daily SMA
EURUSD
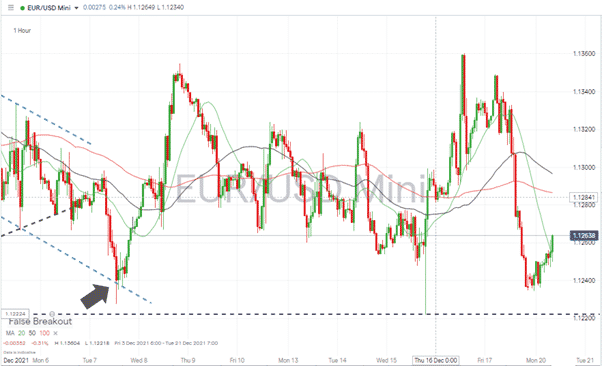
The euro outstripped sterling and yen in terms of lost ground against the dollar last week but has shown surprising strength in Monday’s early trading. Soon after European exchanges on Monday, EURGBP had gained +50 basis points since Friday night’s close. Given the increasing number of lockdowns on the continent, this could be a dead-cat bounce to sell in to.
EURUSD – 1H chart – Monday morning strength
Short positions
- Entry Level 1: Region of 1.2943 – Selling into strength and using the 20 Daily SMA as an indicator
- Price Target 1: 1.12540 – Price low of last week, which is also in line with the low of June
- Price Target 2: 1.10 – In extension, low of May 2020 and ‘big number’ price level
- Stop Losses: Region of 1.13594 – 50 Daily SMA, which has proved a reliable indicator since the euro sell-off began in May 2021
USDJPY
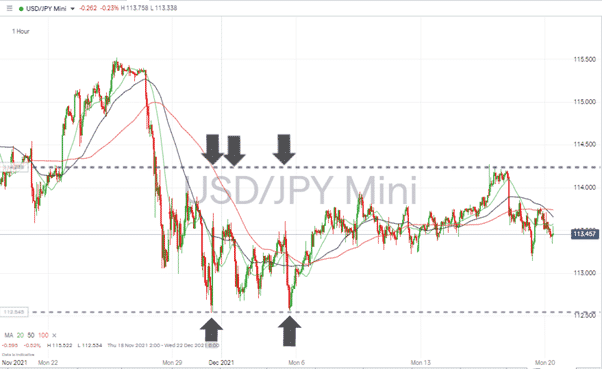
Dollar-yen was the major currency pair that was least impacted by news from the Fed on Wednesday. On a week-to-week basis, the pair is down only 0.11%, but the intra week price moves have widened the sideways trading channel.
The price now sits in the middle of that channel, with moves in either direction appearing equally likely.
USDJPY – 1H chart – New wider Sideways Channel
Source: IG
Long positions
- Entry Level 1: 112.68 – Bottom of sideways trading channel and price low of December
- Price Target 1: 114.27 Top of sideways trading channel and price high of December
- Stop Losses: Below the support provided by the bottom end of the trading channel
Short positions
- Entry Level 1: 114.27 – Top of sideways trading channel and price high of December
- Price Target 1: 112.68 Bottom of sideways trading channel and price low of December
- Stop Losses: Above the top end of the trading channel
Crypto – Bitcoin & Ethereum
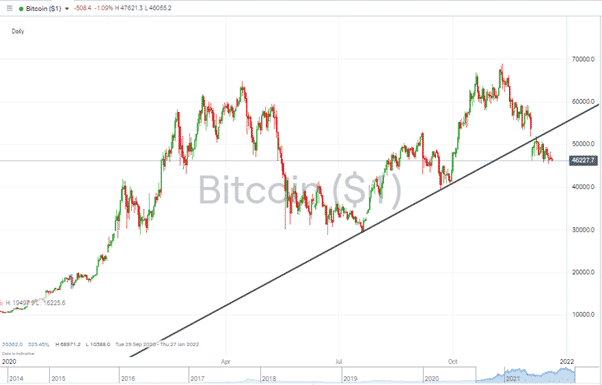
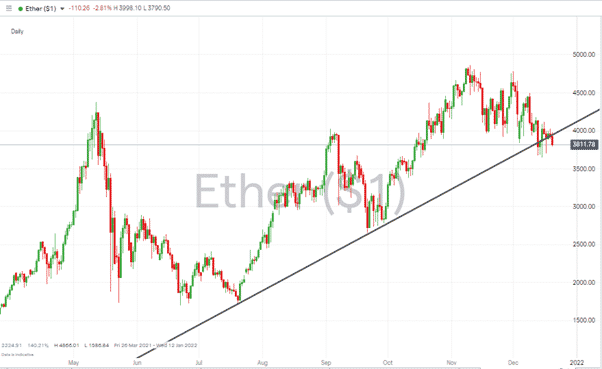
Both of the major crypto coins have failed to bounce off their long-term supporting trendlines. Bitcoin’s break of the trendline preceded Ethereum’s, but ETH’s break has been associated with longer lower wicks. Ethereum is yet to print a daily closing price below the trendline, and should that happen, it would be a significant bearish indicator.
Bitcoin – 1D price chart – Consolidating – but below the supporting trend line
Source: IG
Long positions
- Entry Level 1: 45,487 – Low of 17th Dec
- Price Target 1: 53,428 – Current level of long-term trend line, which now acts as resistance
- Price Target 2: 68,792 – If the swing-low formation holds and price action does show higher-highs and higher-lows, then a breakup through the long-term trend line would open the way to a test of the November high
- Stop Losses: The trendline means there’s not much headroom until the first price target is met. Trading in small size would appear to be prudent.
Ethereum – 1D price chart – Finally breaks supporting trend line
Source: IG
Long positions
- Entry Level 1: 3,645 – Low of Wednesday 15th Dec
- Price Target 1: 4,000 – Psychologically important price level
- Price Target 2: 4,866 – High of 10th November
- Stop Losses: The trendline offers a convenient guide for stop losses with trader discretion to be applied on how far below that price level.
Risk Statement: Trading financial products carries a high risk to your capital, especially trading leverage products such as CFDs. They may not be suitable for everyone. Please make sure that you fully understand the risks. You should consider whether you can afford to take the risk of losing your money.
Forextraders' Broker of the Month
BlackBull Markets is a reliable and well-respected trading platform that provides its customers with high-quality access to a wide range of asset groups. The broker is headquartered in New Zealand which explains why it has flown under the radar for a few years but it is a great broker that is now building a global following. The BlackBull Markets site is intuitive and easy to use, making it an ideal choice for beginners.
