The AUDNZD trade idea identified on 5th of October looks to have played itself out. Depending on how the life-cycle of the trade was managed by those who took it on, the value in the proposition might come from the lessons learned rather than the profits banked. Aussie-Kiwi was taken as an example of how central bank tapering might impact different markets over the next few months, and the ‘known, known’ from the situation is that uncertainty is king.
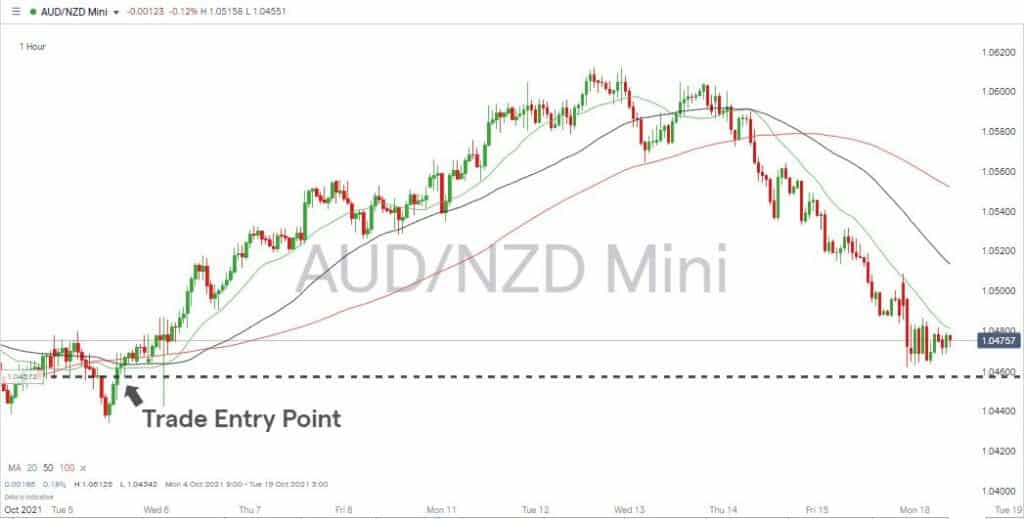
In the instance of the AUDNZD long trade, taking profits would have been possible and advisable. The one lesson from the two-week unravelling of the currency pair being that the “Will they? Won’t they?” style questions surrounding the subject of tapering mean that momentum is present in the market on timescales that involve days rather than weeks. If you can identify a trade entry point, don’t hold back on locking in some profits.
AUDNZD – 1 Hr price chart – as of 18th October
Source: IG
The catalyst for the movement was the RBNZ’s update to the markets on the 6th of October. The OCR (Official Cash Rate) announcement is provided seven times a year, a couple less than many other central banks. That opened the door to the idea that the bank would take the opportunity to tighten NZ monetary policy by two, rather than one notch, on their belt. As it turned out, the Bank increased interest rates by 0.25%, not 0.50%, and the speculative interest which had backed a 0.50% rate hike was on the wrong side of an AUDNZD price surge.
As the monetary hawks unwound their long NZD positions, Aussie-Kiwi picked up more momentum. Longer-held positions which had been identified in the CFTC data for AUD and NZD also unravelled.
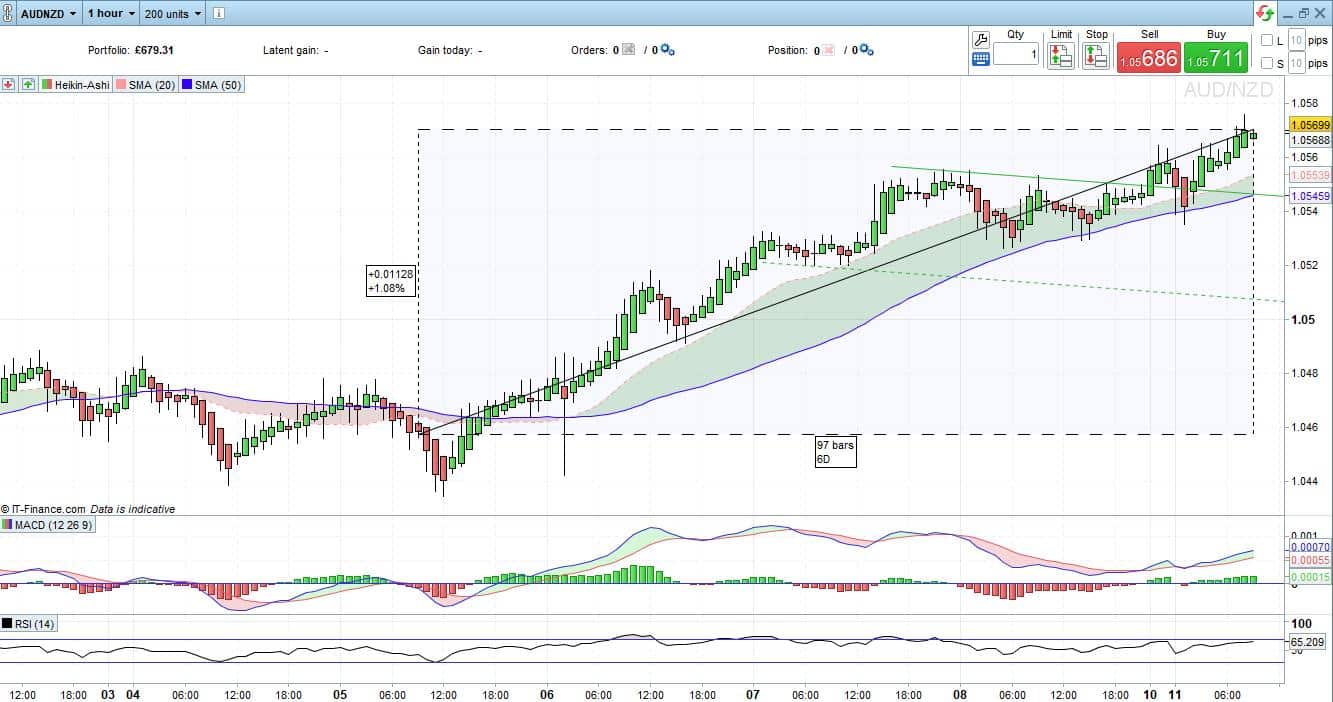
An investor who got into the trade on Tuesday 5th of October at the entry point of 1.04571 would have enjoyed being on the right side of a week-long market move, recording a +1.09% return. The Heiken Ashi candlestick hourly chart below shows the market situation six days later, on Monday the 11th of October.
AUDNZD – 1Hr price chart – Heiken Ashi Candles – as of 11th October
Source: IG
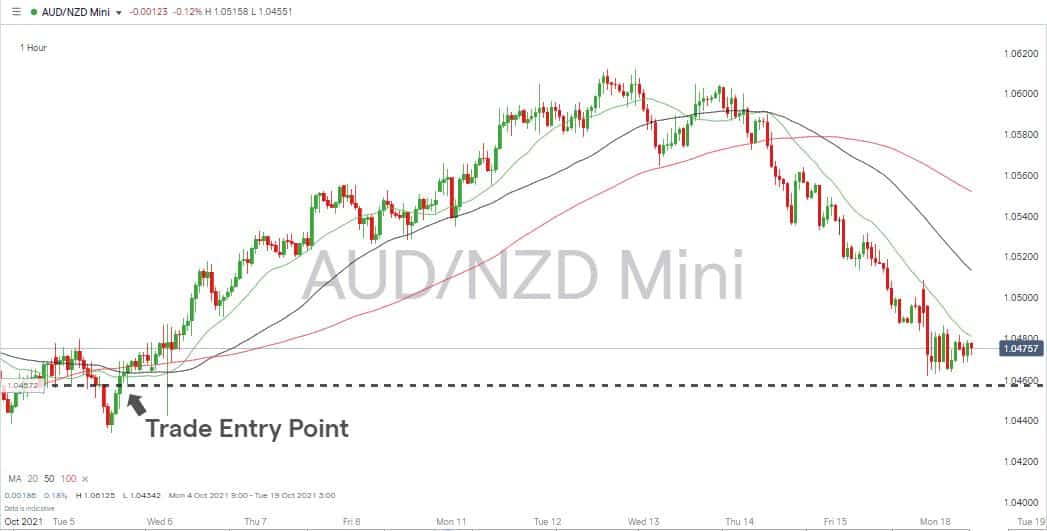
The initial target price of 1.07, explained here, still held at the time, but the touch of the first target price of 1.0614 would hopefully have acted as a signal to lock in at least some gains. Based on the 50% Fibonacci retracement level of the downward price move dating back to the 25th of March, that resistance level was too much for Aussie, and price has since retreated to sit near entry-level. There’s still a chance to close the trade and take some gains, but the juice in the trade has largely drained away.
AUDNZD – 1Hr price chart – as of 18th October
Source: IG
Final Thoughts
Realised profits go to those who used textbook momentum trading strategy trade entry and exit indicators. Those who held on too long can be happy with getting out of a trade at break even. They also gained an insight into how tapering could likely lead to more short-term price volatility rather than month-long trends.
If you have been the victim of a scam, suspect fraudulent behaviour, or want to know more about this topic, please get in touch with us at [email protected]


 Between 74-89% of CFD traders lose
  Your capital is at risk
  Your capital is at risk
  Your capital is at risk