Monday’s equity shakedown raised the obvious question of whether this is a dip to buy or something more serious. The details regarding the relative performance of different sectors during the rout is possibly more revealing and goes some way to answering the question of to buy or not to buy.
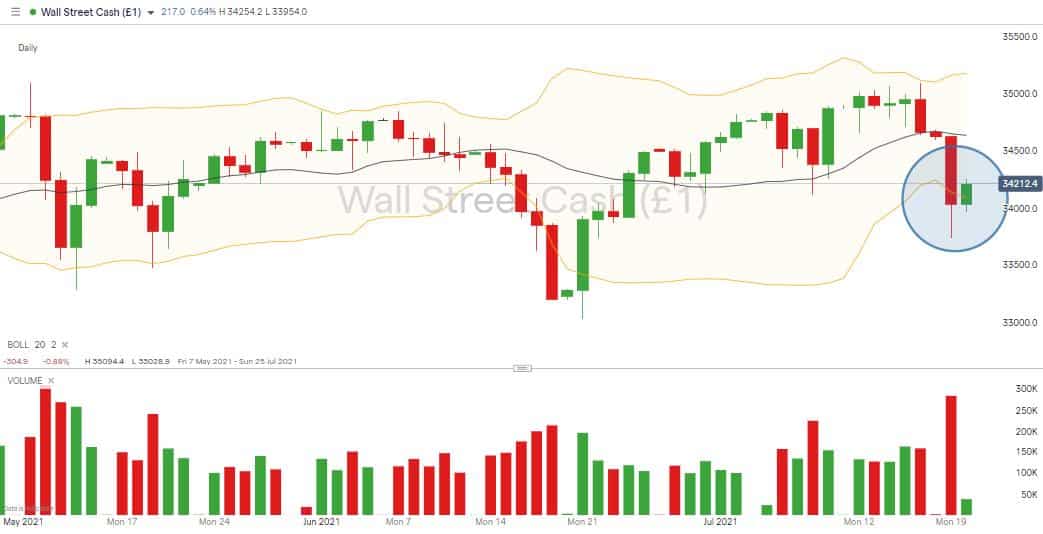
Many have categorised the sell-off as an easily explained and possibly healthy pullback of an over-extended market: the technical indicators do support that. The Wall Street / DJIA index, which on Monday posted its most significant daily drop since October, was as recently as last Friday, trading near the top of the daily Bollinger band range. It had plunged to the bottom of that same range within two trading sessions and on Monday closed below it. A dramatic short-term move, but not altogether surprising considering that since March 2020, the index has almost doubled in value
DJIA Monthly Chart – June to July 2021 – Bollinger bands
Source: IG
Tuesday morning’s recovery rally has added 200 points to the DJIA and brings it back into the Bollinger range. US traders are still some hours off starting their working day, and it can’t be guaranteed they’ll follow the lead of the European markets. The Dow Jones, in particular, is not out of the woods quite yet.
The relative performance of the Dow and Nasdaq tech index needs special mention. Newswires are explaining the Dow’s underperformance is due to it being packed full of cyclical stocks that are exposed to the health of the broader economy and so are particularly exposed to the risk of a Covid resurgence.
The DJIA’s 2.1% price fall on Monday was more marked than the S&P 500, which lost 1.6%, and the Nasdaq Composite fell only 1.1%. That helps support the argument that the sell-off was driven by Covid fundamentals rather than technical indicators pointing to markets overheating. New strains of the disease proving resistant to vaccinations would be alarming and point to a greater downside movement.
The tricky question is, if this is all down to Covid fears, why didn’t the tech stocks outperform the DJIA to a greater extent? It could have been expected that Netflix, Google, Apple, and Amazon would benefit from a further lockdown, in the same way they did during the previous ones. They were all net beneficiaries of events in 2020, so if the risk of the disease making a return is real, they could have even been up on the day. This points towards Monday’s events being a technical pullback rather than something more dramatic, Covid acting as a fall guy for headline writers trying to explain the price move.
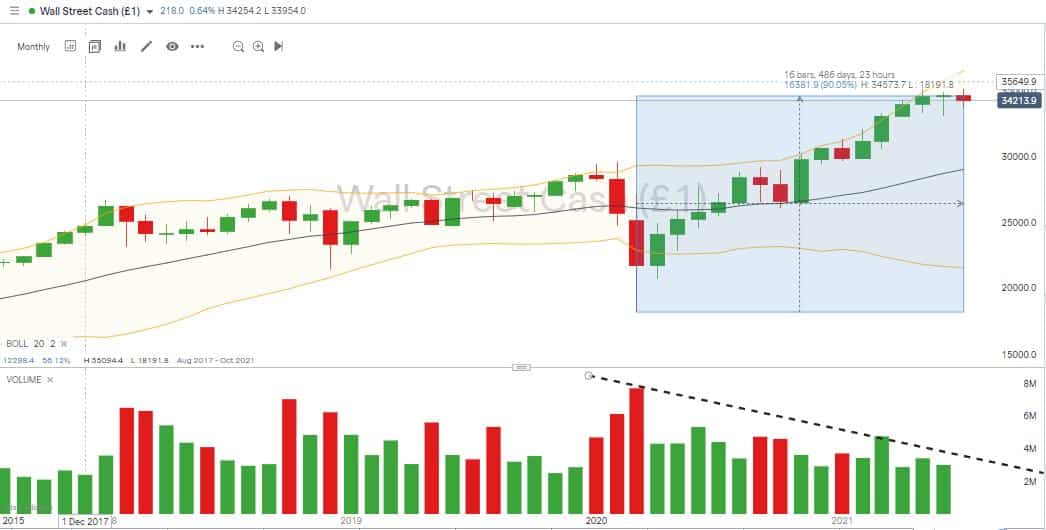
DJIA Monthly Chart – 2015 – 2021 –Volumes on the slide
Source: IG
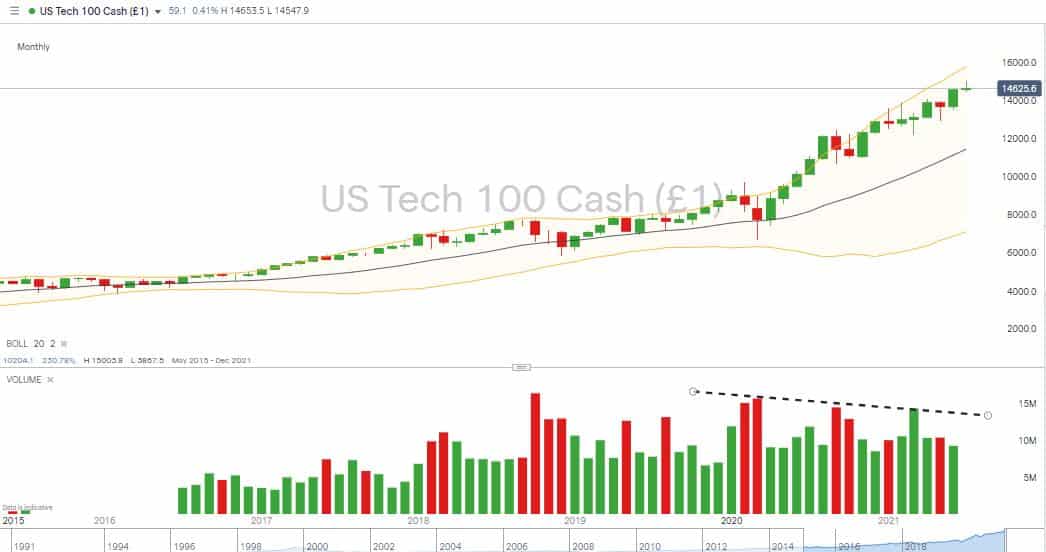
Nasdaq 100 Monthly Chart – 2015 – 2021 – Volumes holding up
Source: IG
Another indicator that backs up the move as technical and a dip-buying opportunity are trading volumes. Over the last twelve months, these have held up in the Nasdaq much better than in the DJIA. Cash is trickling into the Dow at a decreasing rate, but the Nasdaq has seen a much steadier influx of investor cash. The Dow has lacked long-term sponsors, so when the market let off steam, it was the index that fell the most.
If you want to know more about this topic, please contact us at [email protected]


 Between 74-89% of CFD traders lose
  Your capital is at risk
  Your capital is at risk
  Your capital is at risk