Between the 23rd and the 30th of November, all of the assets listed posted price moves of less than 1%.
- GBP/USD +0.05%
- EUR/USD + 0.81%
- FTSE 100 – 0.83%
- S&P 500 + 0.98%
- BITCOIN + 0.30%
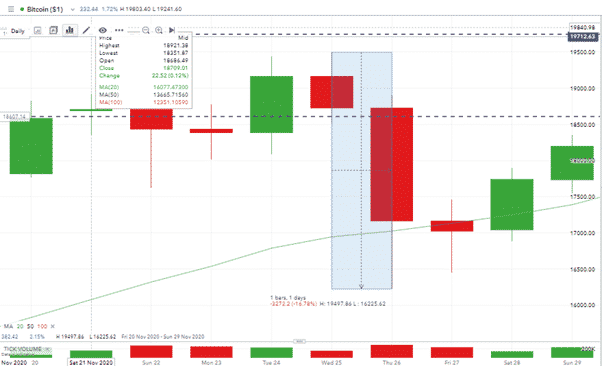
There were, of course, price moves during the intervening days, but only Bitcoin stands out as experiencing any significant price volatility in the five days. The crypto recorded a 16% difference between its high and low prices before finishing the week unchanged.
Source: IG
For the major equity indices and currency pairs, the start and finish prices more accurately detail a week of sideways trading.
The US Thanksgiving holiday played a significant part in terms of keeping a lid on any increasing momentum. From a fundamental perspective, the threat of COVID infection levels increasing and the relatively smooth handover of power in the White House appear to be cancelling each other out.
What this means for the coming days is, of course, anyone’s guess but it might be worth reading beyond the headlines and following the charts for a while.
GBPUSD
Reports on the Cable market are focussing on the likelihood of a Brexit deal being reached. The resumption of face-to-face negotiations and the fact that the deadline for any agreement is looming has done little to move price.
Source: IG
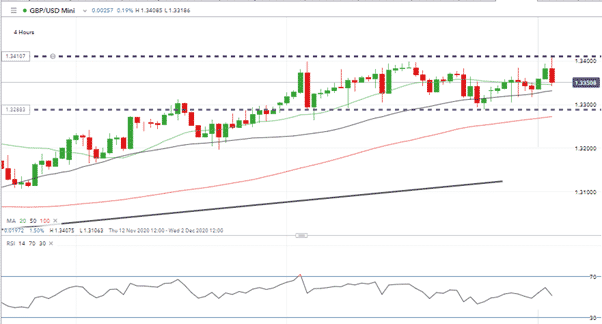
The four-hour chart shows that price broke the 1.34 level early in Tuesday’s European session but has since fallen back to trade below that resistance level.
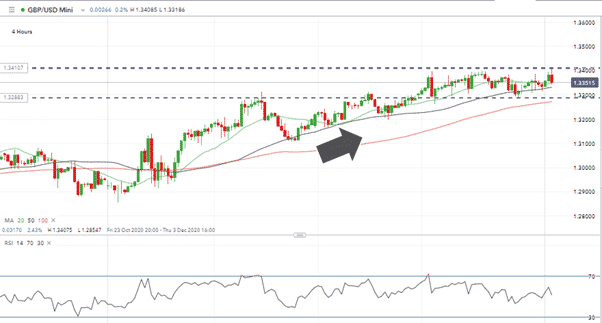
The touch and bounce of the 4H 20 SMA and the fact that the 20, 50 and 100 SMA’s are all above each other confirm that price action is currently bullish.
News from the corridors of Brussels or London could cause a jolt either way but the preferred option appears to be long positions. The sideways shift since Monday the 23rd would then be easily explained as a week-long consolidation pattern as part of a long-term bullish trend.
Source: IG
The bullish sentiment for GBPUSD is based as much on dollar weakness as it is GBP strength. The safe-haven element of USD failing to find many fans at present while a series of positive news stories keep on being released.
- China’s Caixin manufacturing purchasing managers’ index suggests a recovery is on the way. It rose to 54.9 from October’s reading of 53.6. A significant ‘beat’ considering a Reuters’ poll of analysts forecast it would fall to 53.5.
- Also, on Tuesday, the Nationwide measure of UK house prices showed a more considerable than expected increase. Something likely to feed through in improved consumer sentiment in the all-important Christmas shopping period.
EURUSD
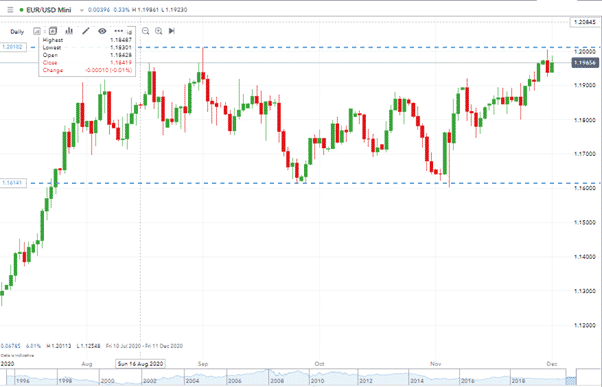
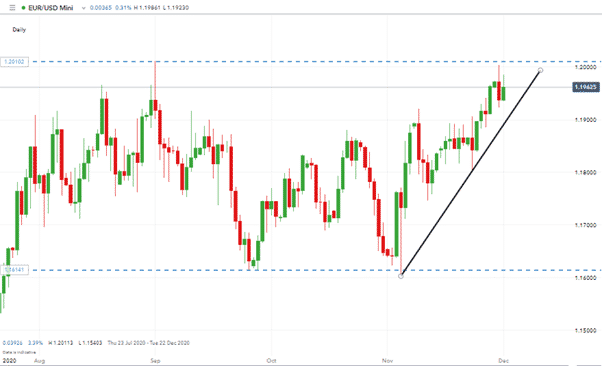
EuroDollar is hitting a longer-term resistance level. The Daily chart is showing that price is struggling to close above the 1.20 resistance.
Source: IG
Those already looking ahead to 2021 and reading reports about a rotation into risk may be looking to take long positions.
Source: IG
The supporting trend line dates back to the 4th of November. Given the steepness of the line, there is potential for a short-term setback and therefore a risk associated with any long positions taken with stop-losses set just below the line. A pull-back or conclusive break of 1.20 could be seen by many as a buying opportunity.
 Between 74-89% of CFD traders lose
  Your capital is at risk
  Your capital is at risk
  Your capital is at risk